

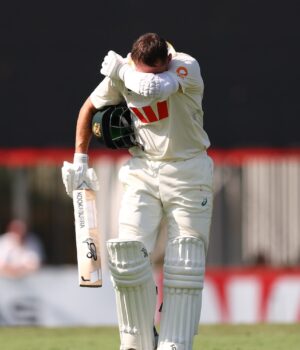
Source : ABC NEWS
Australia’s men’s head cricket selector, George Bailey, pointed out some home truths recently when questioned on the woes of Test number three Marnus Labuschagne.
“Our batting group in its entirety, not just Marn, probably hasn’t been functioning as successfully as we would like,” Bailey said, and he’s not wrong.
With the first of three Tests against South Africa beginning on Friday ahead of a mammoth run of matches against New Zealand, India and England, Australia’s batting line-up will be scrutinised like never before.

Marnus Labuschagne picked a good time to score a century ahead of the first Test against South Africa. (Getty Images: Robert Cianflone, file photo)
Since the beginning of the Border–Gavaskar Trophy at home in 2024, Australia has played 18 Tests with only three batters averaging more than 40: Steve Smith (49.4), Travis Head (46.25), and Alex Carey (40.3).
Beau Webster (33.5) and Cameron Green (30.16) are the only other batters averaging over 30 during the period.
Australia’s bowlers have repeatedly dug the batters out of a hole, with the team winning 13 of those 18 matches.
Darren Lehmann sees clear reasons for the decline in Test batting, with serious consequences for the game (Getty Images: Steve Bell)
But Australia’s batters aren’t alone: Across all 12 Test-playing nations, the game has undergone a huge transition with batters fading and bowlers dominating.
The rise of T20 cricket, better balls and seaming wickets have all played a part.
ABC Sport has done an analysis of all Test batters over the past 40 years with the help of ABC radio cricket statistician, Ric Finlay.
Steve Smith, Travis Head and Alex Carey have all averaged more than 40 over the past 18 Tests. Marnus Labuschagne is in the 20s. (Getty Images: Phillip Brown)
We’ve looked at batters from one to seven and found the same patterns across all positions.
We could list a table of 40 years but to make things easy, we’ve broken it down to five-year periods that include every test played from the beginning of 1987 to the most recent Test between England and Pakistan.
To see the patterns, we’re narrowing the numbers down to batting averages, run rates and average balls per wicket.
Looking at these figures, you can see that the average of all batters in positions one to seven peaked in the period between 2002 and 2016 before dropping back to the low 30s.
It’s easier to visualise with a chart that shows the year-by-year average as well as a rolling five-year average to even out the yearly variations.
The period between roughly 2003 and 2014 is when averages were highest.
This coincides with a golden period for world-class test batsmen when the likes of Sri Lanka’s Kumar Sangakkara, Australia’s Ricky Ponting, South Africa’s Jacques Kallis, England’s Kevin Pietersen, India’s Virender Sehwag and the West Indies’ Shivnarine Chanderpaul, to name just a few, were at their peak.
Ricky Ponting was at his peak in the early 2000s. (ABC News)
The rolling five-year average is now at a 40-year low, but that only tells part of the story.
To understand more about the decline of Test cricket batting, two other charts fill in the picture.
The first is strike rate: how many runs batters score per 100 balls.
Batters’ strike rates have increased across the board from 41.34 to 58.13: that’s almost 17 runs per 100 balls, which is the equivalent of an extra run per over.
But while batters are scoring much faster, they’re also getting far out more quickly.
Bowlers are now taking wickets faster than at any time in the past 40 years.
In 1989, top-order batters were lasting more than 85 balls between wickets in the rolling five-year average, while as of this year, wickets are falling every 58 balls — an all-time low.
From the peak to the current trough that’s a fall of more than 32 per cent.
It’s no accident that we’re seeing so many shortened Test matches, like the two-day match in McKay against Bangladesh in August.
The overall figures are mirrored in virtually every individual batting position with averages on the whole going down.
In other words, we have seen a fundamental shift in the battle between the bat and ball playing out over the past four decades and right now, while batters are scoring more quickly, the bowlers are on top.
The same is true for Australia’s one to seven batters.
Again we see the early 2000s peak in averages when Ricky Ponting, Matthew Hayden, Justin Langer, Damien Martyn and Adam Gilchrist were in their pomp.
The combined batting rolling average for positions one to seven is now at a 40-year low.
The strike rate rolling average is at an all-time high, although only marginally ahead of that early 2000s era.
But the balls per wicket figure rolling five-year average has dropped alarmingly from its starting high of 98.33 to its current all-time low of 54.26
That’s a fall of almost 45 per cent.
To put it another way, opposition bowlers are taking Australian wickets almost twice as quickly as they were 40 years ago.
So, why is this happening?
Former Australia coach and batter, Darren Lehmann, who’s currently coaching English country side Northamptonshire, highlights four major changes in cricket that are all linked.
Darren Lehmann (right) as coach of Australia in 2014, with the current head of selectors, George Bailey, and the late Rod Marsh. (Getty Images: Scott Barbour)
The first is the rise and rise of T20 cricket.
“Now they [batters] just don’t leave balls,” he told ABC sport.
“They have to score off more, so they play more shots to more risky balls in Test cricket,”
“Hence they go at balls they shouldn’t go at, which they normally wouldn’t have 20 years ago.”
The second reason, Lehmann said, was the state of Test wickets around the globe, which he said were spinning and seaming more and earlier.
“They’ve got more in them and that is a by-product of making sure you get results,” he said.
Lehmann said the balls used in Test Cricket, the Kookaburra and Duke, had added an extra layer of lacquer, which meant they stayed harder and the seam stayed prouder for longer, creating more movement.
“Blokes are playing shots to balls they shouldn’t because they’re trying to score before they get one that gets them out,” Lehmann said.
The fourth reason bowlers are on top of batters is the one that ties it all together: data analytics.
“You’re honing in on the weakness of players better than you did in the past and you’re relentless with that.
“So, if a bloke can’t cover drive or doesn’t play well off the front foot, you now target that area with more balls, and you don’t go away from that.”
Mitchell Starc can be relied on to take wickets. (Getty Images: Albert Perez/Cricket Australia)
“If a bloke gets out to a left-armer all the time, well you get Mitchell Starc straight on.”
Sooner or later, the batter’s lack of patience, the moving ball and seaming wicket combined with the bowler’s knowledge of their opponent’s weakness will result in a wicket.
Cricket’s delicate balance between bat and ball has fundamentally shifted and the cost is two-day test matches like the Boxing Day Ashes test, which cost Cricket Australia millions.
Lehmann said wickets needed to get flatter or lacquer taken off balls in order to shift the balance back towards batters.
“There are consequences: two-day games in Test cricket can cost people their jobs.”
Failing Test batters can also lose one of the most coveted jobs in Australian sport.